The MACD (Moving Average Convergence/Divergence) is in category of trend indicators which shows relationship between prices and moving averages. The moving average convergence divergence calculation is a lagging indicator used to follow trends. It consists of two exponential moving averages and a histogram.
The default values for the indicator are 12,26,9.
Three main signals generated by the indicator are crossovers with the signal line (red line), with the x-axis and divergence patterns. Because the MACD is unbounded, it is not particularly useful for identifying overbought and oversold levels.
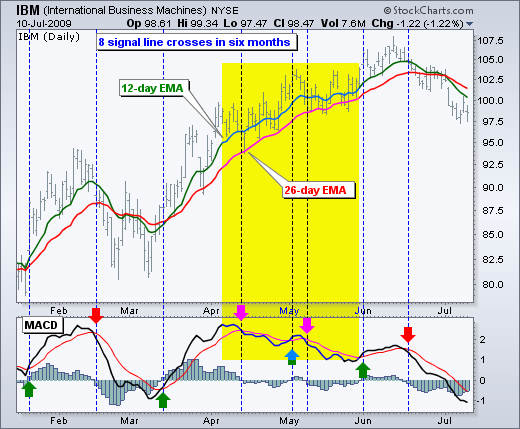
Crossovers with the signal line:
- If the MACD line is rising faster than the Signal line and crosses it from below, the signal is interpreted as bullish and suggests an acceleration of price growth;
- If the MACD line is falling faster than the Signal line and crosses it from above, the signal is interpreted as bearish and suggests an extension of price losses;
- Signal line crossovers at positive or negative extremes should be viewed with caution.
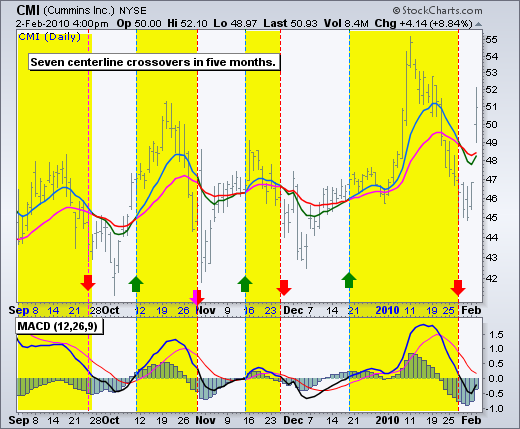
Centerline crossover:
- A bullish signal appears if the MACD line climbs above zero;
- A bearish signal presents if the MACD line falls below zero.
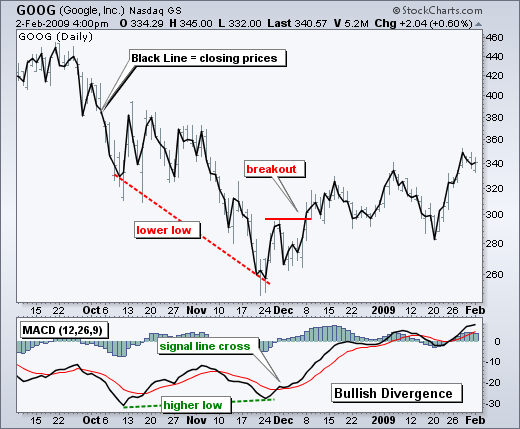
Divergence:
Divergences should be taken with caution. Bearish divergences are commonplace in a strong uptrend, while bullish divergences occur often in a strong downtrend. Yes, you read that right. Uptrends often start with a strong advance that produces a surge in upside momentum (MACD).
- If the MACD line is trending in the same direction as the price, the pattern is known as convergence, which con rms the price move;
- If they move in opposite directions, the pattern is divergence.


Hello. impressive job. I did not anticipate this.
With thanks! Valuable information!